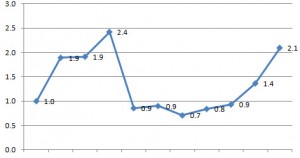
Each week I track the number of properties that have come on the market in Ventura, Camarillo and Oxnard. I also track the number of homes that went under contract. I’m no statistitian but I do like numbers. So I may be off a little bit, but you get the general idea of how our markets are doing.
Here is a graph showing the ratio of Ventura homes on the market to homes going under contract since the first of the year. As you can see in January, for every house that came on the market, another property went pending. As of March 24, two homes go on the market for every pending contract (e.g., a slowing market). (BTW, these stats do not include unrepresented sellers aka FSBO and new construction properties that are “shadow inventory” not yet in the Multiple Listing Service database; which would mean the ratio is higher than what this reflects.)


